GMOS IFU overview
The IFU and related components are described in detail on the GMOS Web pages.
The main IFU samples a 5x7” field with a 2D array of hexagonal microlenses, coupled to 1000 optical fibres. There is also a smaller field that samples the sky background 1’ away from the target.
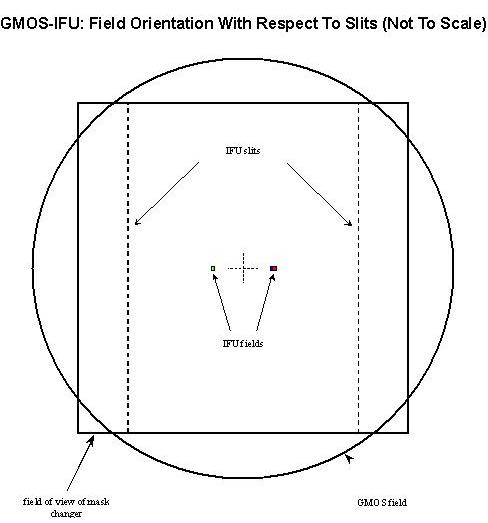
Geometry of the IFU input fields & output slits, with respect to the GMOS field.
The output ends of the fibres (interleaved from both fields) are rearranged into two linear slits at the image plane of the spectrograph, which are dispersed to form two banks of spectra.
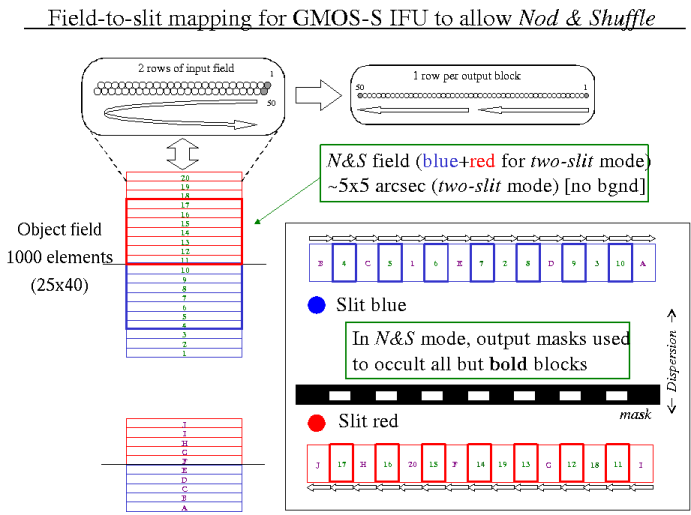
Field-to-slit mapping for the GMOS-S IFU. The output slits are divided into blocks of 50 fibres, each mapped from 2 adjacent rows of the input field, with small gaps between the blocks to help with fibre identification etc.
Individual fibre spectra are extracted from the detector image and used to reconstruct a 3D image of the original observation space (and thence 2D flux and velocity maps etc.).
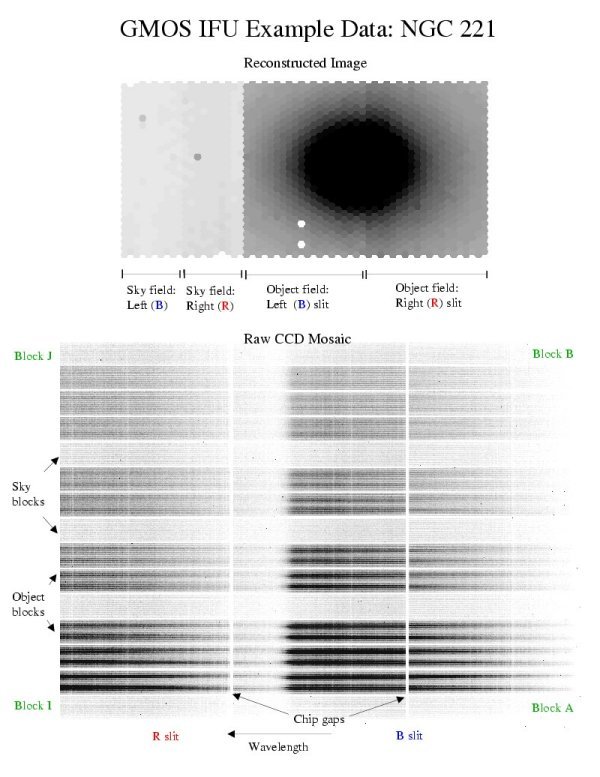
Example row-stacked IFU spectra (bottom) and 2D intensity maps of the IFU fields that have been reconstructed from them (top).